Ship Data Analytics and Visualization Platform
Designing and building an analytics platform tailored for the marine industry, featuring data import, visualization, and an admin panel to manage users and system parameters
Client Challenge
The client - Marine Cloud - is a forward-thinking startup in the maritime sector, focused on enhancing the analytical capabilities of the shipping industry. They needed a simple cloud-based solution that would allow ship managers and operators to not only upload and process but also thoroughly analyze photometer sensor data from their fleet, streamlining maritime data management.
The challenge lay in transforming this concept into a functional MVP within a tight three-month timeframe. This required the creation of a robust platform capable of handling complex data imports, facilitating dynamic data visualization, and managing user interactions across various levels of access, all while ensuring scalability and security to support future enhancements and user base growth.
Service Process

The SoftKraft team embarked on the Marine Cloud project with a strategic approach, beginning with comprehensive Event Storming sessions to fully understand the project's scope and client requirements. This phase was crucial in identifying key functionalities and potential challenges, setting a solid foundation for the subsequent development stages.
The development team adhered to our commitment to quality and followed our standard working processes. This approach ensured clear and consistent communication throughout the project lifecycle.
Communication with the client was streamlined and efficient, utilizing only two primary channels: on-demand online meetings for regular, real-time discussions along with Slack and email for ongoing updates.
Project Results
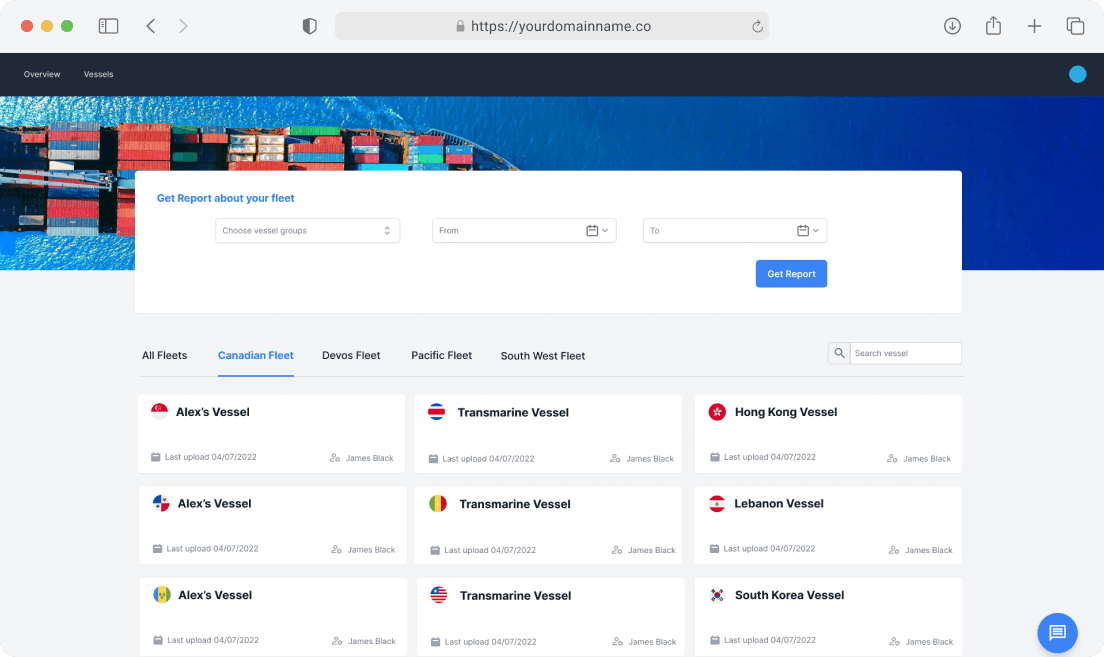
An intense development process culminated in the successful launch of a functional MVP that met all initial project scope requirements. The platform enables efficient data handling and visualization capabilities, such as:
- Uploading CSV and XLS manually-filled files from photometers.
- Importing and validating data to ensure accuracy and reliability.
- Displaying detailed and summary charts per vessel, facilitating easy data analysis.
- Allowing the download of charts in PDF format for offline review and reporting.
- Defining various parameters and chemical programs, including parameter recommendations and acceptable ranges within each program.
In 2024, the project underwent significant updates to further enhance its functionality, including:
- Extended capabilities for uploading and processing various data file types.
- User interface improvements for more efficient report generation and saving in PDF format.
- Addition of new data types and expanded data filtering options to cater to complex analysis needs.
- Interface adjustments to improve overall user experience.
- New types of user accounts with varying permission levels to accommodate a new client management structure.
Deliverables
- User-friendly web app for seamless data imports
- Data visualization tools that display vessel-specific and fleet-wide insights
- Admin panel to manage system parameters and access permissions, enhancing the adaptability of the platform to different user needs
Benefits
- Ship managers can upload sensor data files and analyze specific data points over selected periods
- Operators have fleet-wide data visualizations that aggregate information across multiple vessels, enhancing operational oversight
Want to Learn More? Need a Project Quote?
Reach Out Today!
We're always ready to help
Blazej Kosmowski
CTOMarek Petrykowski
CEO- Meet our seasoned engineering leaders
- Leverage our in-depth industry knowledge
- Get a free quote for your project